

The App Graph
The app graph is a picture of a Sygnal app: every component, what renders what, which components talk through EVENTS, context and PARENT, which actions write which state, and what sygnal-check found wrong. It is built from your source, without running it, and drawn as one interactive page. Use it to find your way around an unfamiliar app, to answer “who handles NAVIGATE?” or “who writes state.cart?”, and to see what a branch changed.
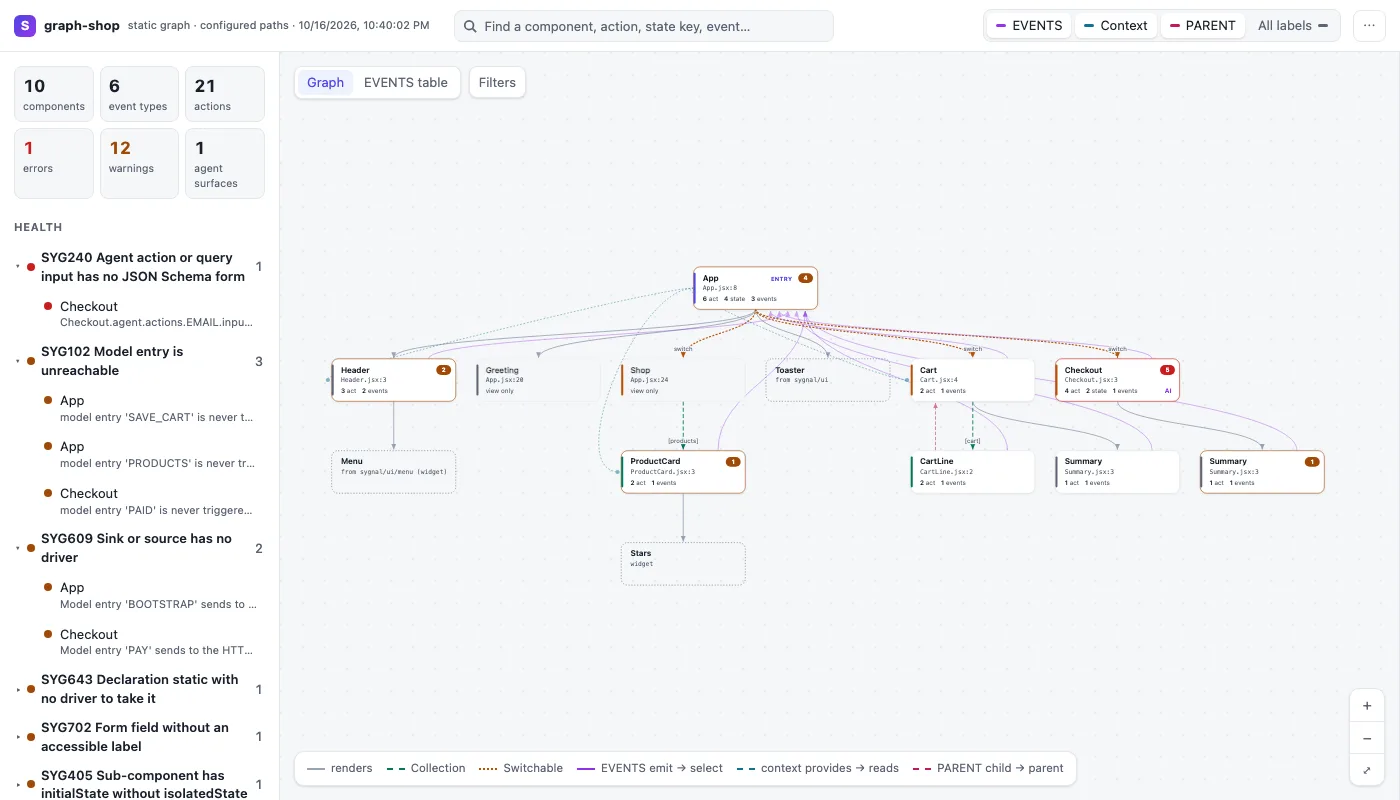
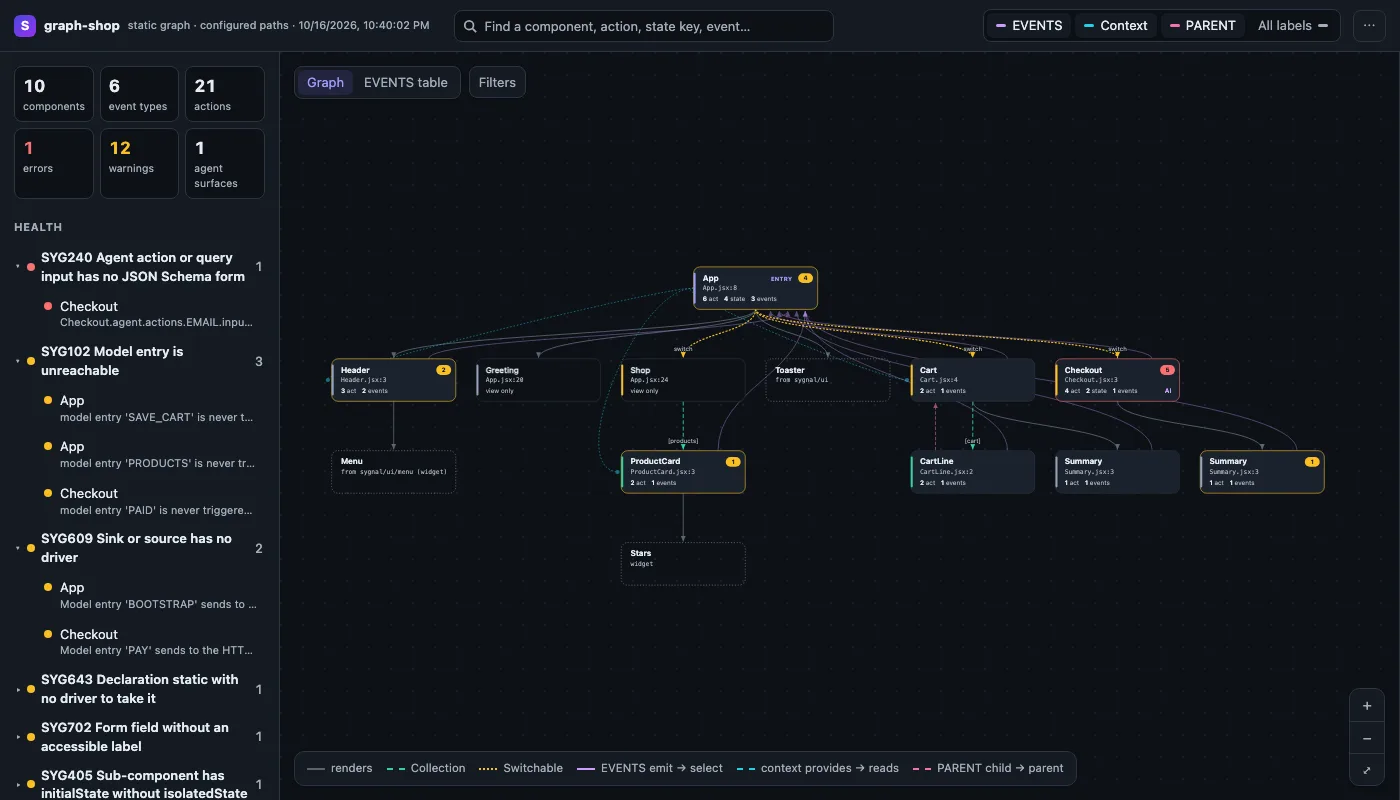
The same page opens in several places:
| Where | How | Updates |
|---|---|---|
| A browser tab | npx --no-install sygnal-check --graph=html | No: a snapshot file |
| A browser tab, live | npx --no-install sygnal-check --graph=html --watch | On every save |
| The Vite dev server | http://localhost:5173/__sygnal/graph | On every save, plus live data from the running app |
| VS Code | Sygnal: Show App Graph | As you type |
| Sygnal DevTools | the App graph button | As the app runs (the runtime graph) |
All of them need sygnal-check 0.10.0 or later in the project (npm install -D sygnal-check); the VS Code extension bundles its own copy.
Opening it
Section titled “Opening it”From the command line
Section titled “From the command line”npx --no-install sygnal-check --graph=htmlThis writes one self-contained HTML file, sygnal-graph-<project>.html, to the operating system’s temp directory, prints its path and opens it in your default browser. The page title is the name in the nearest package.json. Pass paths as for any check (npx --no-install sygnal-check pages --graph=html for a Vike app); with none, it reads the config file’s paths, else src. --strict, --a11y and the config file’s ignore apply as they do to the findings list.
| Option | |
|---|---|
--out <file> | Write the page to this file instead (to keep or share it). It isn’t opened unless you also pass --open |
--open / --no-open | Open the page, or don’t |
--editor <name> | Where file links open by default: vscode (the default), cursor, windsurf, idea or none. The page’s menu can change it, and remembers the choice |
The browser never opens when the CI environment variable is set or when stdout is not a terminal, even with --open; the path is still printed.
Live, with --watch
Section titled “Live, with --watch”npx --no-install sygnal-check --graph=html --watchThis serves the page from a small local server instead of writing a file, opens it once, and pushes a new graph whenever you save a source file or the config file. The page keeps your zoom, selection, search and trace across updates and marks for a few seconds the components that were added or changed (removed ones are named in a notice). The header shows when it last updated; if the server stops, the page says so and keeps working with the last graph. Ctrl-C stops the server.
| Option | |
|---|---|
--port <n> | Listen on this port (default: a free one) |
--poll[=<ms>] | Check for changes every <ms> milliseconds (default 200) instead of using file-system events, for network drives and some container mounts |
--watch can’t be combined with --out (a saved file can’t be updated) or with --base.
In the Vite dev server
Section titled “In the Vite dev server”With the Vite plugin and sygnal-check installed, the dev server serves the live page at /__sygnal/graph and prints its address under Vite’s own:
➜ Local: http://localhost:5173/ ➜ Sygnal graph: http://localhost:5173/__sygnal/graphThe Vike dev server prints the same line. astro dev prints it under Astro’s own banner ([@sygnal/astro] Sygnal graph: …; the integration takes the same graph option). Without sygnal-check 0.10.0 or later resolvable from the project, the line says what to install instead (Sygnal graph: needs sygnal-check 0.10.0 or later in this project), and the URL answers 404 with the same hint.
It is the --watch page without a second process: the dev server rebuilds the graph after each change, and the same build feeds the sygnal-check findings in the terminal, the browser console and the error overlay, so they always agree.
Because the page is served from the app’s own origin, it can also show live data from the app open in another tab. A Live data switch in the header turns on once an app tab is connected. It follows the app tab you focused last, and then:
- fades the components that have no mounted instance;
- shows how many instances a component has (
×3); - flashes a card when one of its actions runs;
- shows each instance’s current state in the detail panel.
Live data needs the app’s DevTools bridge, which the plugin installs in dev (it stays off with devtools: false), and runtime diagnostics on. Open the graph and the app on the same host name: a tab on localhost and a page on 127.0.0.1 can’t see each other.
To match running instances to the cards, the dev server marks each component function with its static key. This happens only in the dev server: vite build output has no marks, no graph code and no bridge. sygnal({ graph: false }) turns off the route, the marks and the bridge.
In VS Code
Section titled “In VS Code”The Sygnal extension adds Sygnal: Show App Graph to the command palette, the editor’s context menu and the … menu of a JavaScript or TypeScript editor. It opens the page in a panel beside your code, one per project. The panel updates as you type, including unsaved changes; moving the cursor into a component selects its card; file links open the file at that line. It uses your theme’s colors.
In Sygnal DevTools
Section titled “In Sygnal DevTools”The DevTools extension’s panel has an App graph button. It draws the runtime graph of the inspected page (inspect()), so it shows what is mounted now rather than what the source could render:
- one card per component under each parent, labelled
×Nwhen there are several instances (a Collection’s items are one card), with each app (run()) as its own group; - a card flashes when one of its actions runs, and the detail panel lists recent actions and each instance’s state;
- the health list replaces the static checks with “not seen yet” groups (an action that hasn’t run yet isn’t an error);
- it refreshes while open, shortly after components mount or unmount and after actions.
It needs sygnal/diagnostics on the page (the Vite plugin loads it in dev).
What the page shows
Section titled “What the page shows”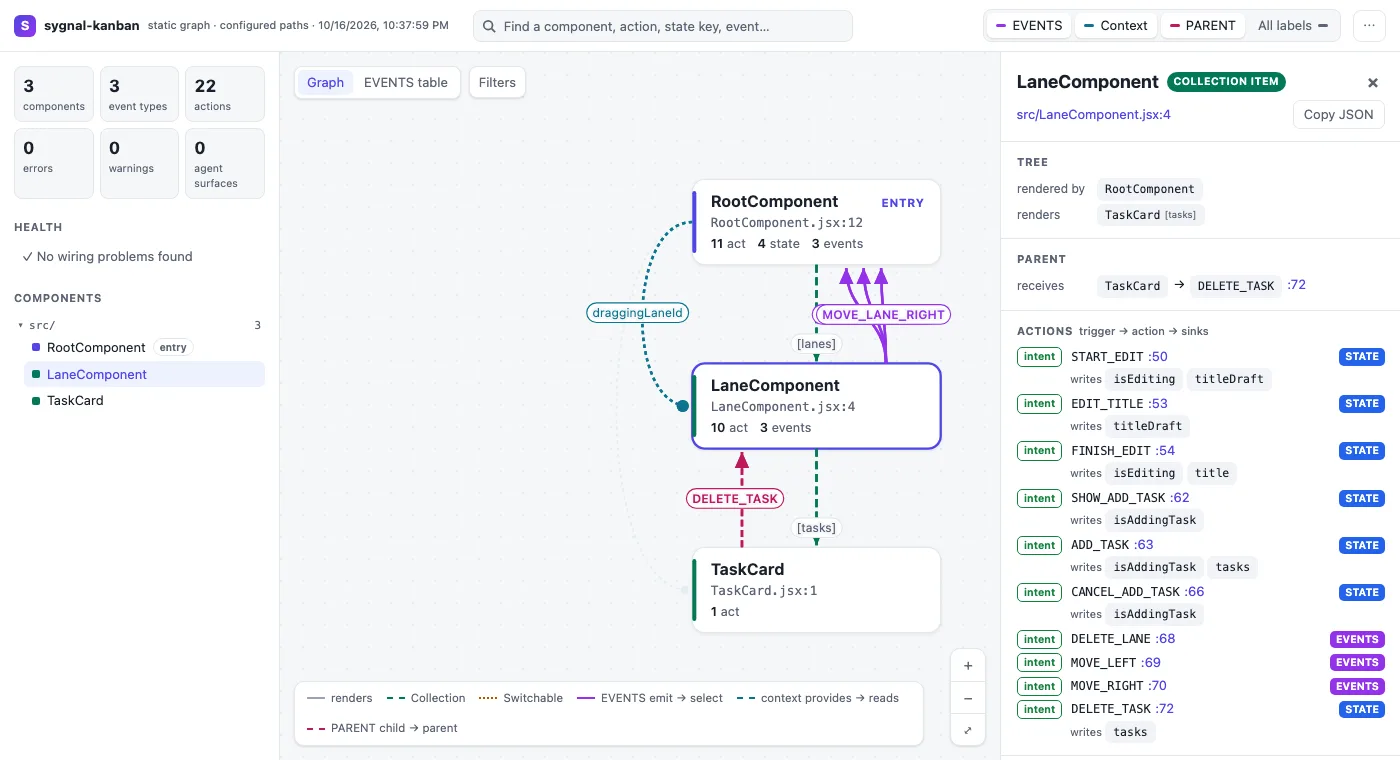
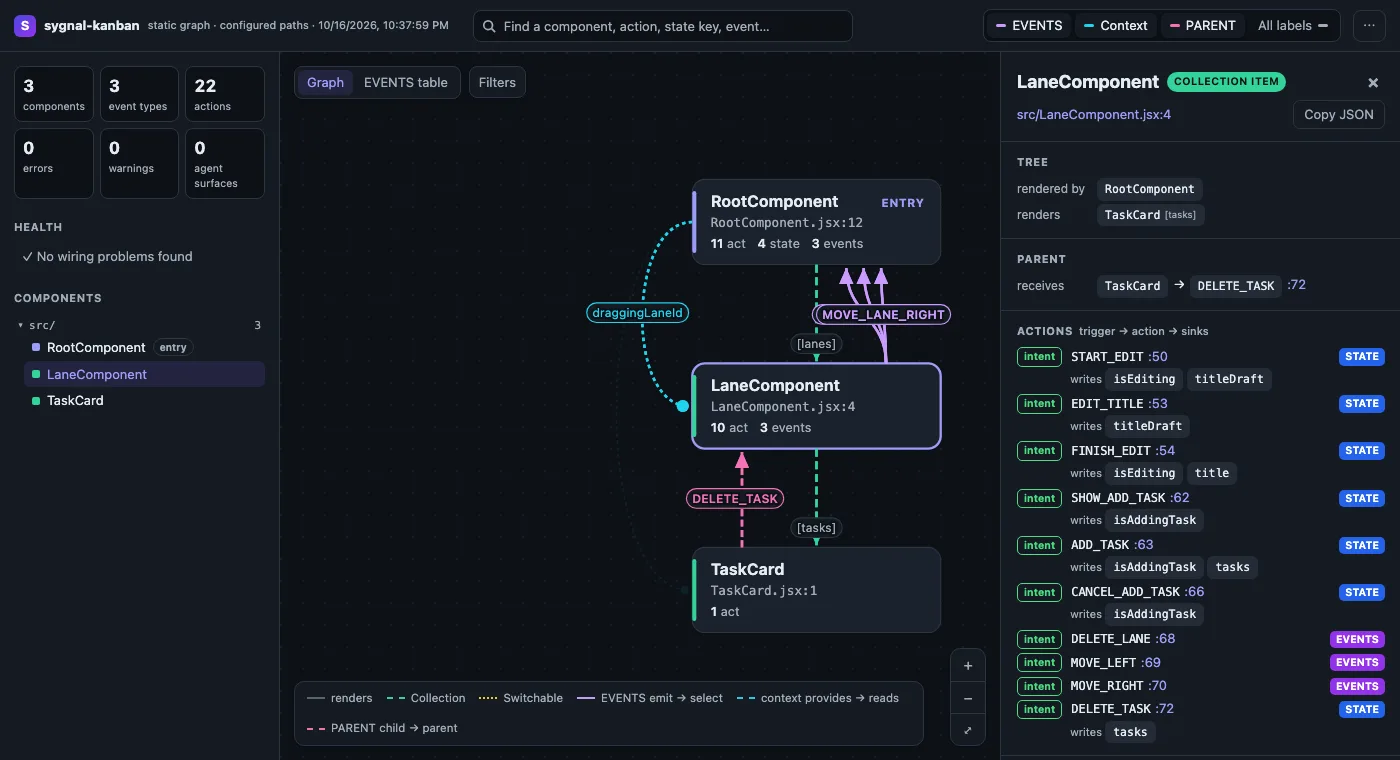
Each component is a card with its name, file:line, and counts of its actions, state keys and event types. Tags on a card:
- entry: a component passed to
run()ordefineElement(), or a Vike+Page,+Layoutor+Wrapper. Entries are laid out first. In a Vike app, page and layout cards are labelled with their route. - AI: it has an
agentdeclaration. - a number: its findings, red for errors and amber for warnings.
- view only: a function rendered as a component tag with no statics (a lighter card).
- dashed cards: a component imported from a package (
Toasterfromsygnal/ui), a widget, or a tag that isn’t in the scanned files.
| Edge | Means |
|---|---|
| Solid grey | Renders it as a tag |
Green dashed, [items] | Renders it as a Collection item, from that state key |
Orange dotted, switch | Renders it in a Switchable |
| Dashed, in the entry colour (Vike apps only) | A +Wrapper or +Layout around the next layout or a page |
| Purple | EVENTS: the emitter to the component that selects the type |
| Cyan dotted | Context: the provider to a component that reads the field |
| Pink dashed | PARENT: a child’s PARENT sink to the parent’s CHILD.select(Child) |
The EVENTS, Context and PARENT overlays each have a switch in the header; All labels shows every edge label instead of only the selected component’s.
The sidebar
Section titled “The sidebar”At the top are the counts: components, event types, actions, errors, warnings and agent surfaces. Below them:
- Health: the findings, grouped by code with the code’s title, errors first. It also lists model entries nothing triggers (SYG102’s findings, including the info ones), and what only the whole graph shows: selectors the view never renders, events nobody selects or nobody emits, controls nothing listens to, context read with no provider, components rendered but not scanned, and the AI agent surface (which components expose tools, and which tools ask the person first). A check that a finding already reports isn’t listed twice. Click an item to select its component.
- Components: every component as a list grouped by directory. It is the same graph as the canvas, as buttons, and is the view a screen reader uses.
The detail panel
Section titled “The detail panel”Select a card (click it, or press Enter on it) to see:
- its findings, with the fix and a link to the Error Reference;
- what renders it and what it renders, and the
PARENTactions it receives; - its actions as trigger → action → sinks, with the state keys each one writes (behavior actions are grouped under their behavior);
- its state keys, calculated fields, and the state keys its view reads;
- context it provides and reads, and where each field comes from;
- the EVENTS it emits and selects;
- its DOM inputs, each marked ✓ (the view renders it), ✗ (it doesn’t, or the element is inside a child component) or ? (not known statically);
- controls,
ELEMENTcommands, timers,usesand agent tools; - a root’s drivers, and whether each comes from its
driversstatic orrun()’s argument.
Every line number opens your editor at that place. Copy JSON copies the component’s part of the graph.
Click an event type, a context field, an action or a state key anywhere in the detail panel, and the page lights up everything involved: for an event, its emitters and selectors; for a context field, its provider and readers; for a state key, the components that own it, the actions that write it and the components that read it. The trace stays until you clear it.
Search, filters and views
Section titled “Search, filters and views”- Search (
/) finds components by name, file, action, state key, event, context field, selector, control or SYG code, with a list of results. - Filters: by kind, only components with problems, hide view-only leaves, hide behavior actions, the AI surface only, and components no entry reaches.
- EVENTS table: every event type with its emitters and selectors, sortable and filterable. Click a type to trace it on the graph.
- The
⋯menu: Download SVG, Download graph JSON, Copy as Mermaid, the editor for file links, and the light / dark switch (the page follows your system’s theme until you change it).
Keyboard
Section titled “Keyboard”| Key | |
|---|---|
| Tab | Reach the canvas (one card at a time is in the tab order) |
| Arrow keys | Move along the edges: up to a parent, down to a child, left and right along the row |
| Enter, Space | Select the focused card |
/ | Search |
F | Fit the graph on screen |
| Esc | Clear the selection and the trace (in the search box: clear the search) |
Large apps
Section titled “Large apps”The page changes how it draws by the number of components:
| Components | Layout |
|---|---|
| Up to 60 | Every card, each tree laid out from its entry down |
| 61 to 150 | Cards grouped by directory, each group laid out on its own; a minimap; selecting a card focuses it |
| Over 150 | Each directory group starts folded into one card with its counts; edges between folded groups are bundled into one edge labelled ×N |
In every size, zooming out far enough hides card text (and, in the grouped layouts, the overlays) so the shape stays readable, and the component list, search, health list and EVENTS table work as usual.
- Folding: open a group by clicking it (or from the component list), fold it again with − fold; the Filters menu has Open all groups and Fold all groups. Tracing an event or field opens the folded groups that hold its ends.
- Focus: in the grouped layouts, selecting a component shows only its ancestors up to the entry, its children two levels down, and its EVENTS, context and
PARENTpeers, with breadcrumbs; Show all goes back. - Where many components emit or select the same events, the page may draw one node per event bus instead of every emitter-to-selector pair.
- Past about 400 drawn cards the page paints a canvas instead of SVG to stay fast. The component list is then the keyboard path.
Comparing with a branch (--base)
Section titled “Comparing with a branch (--base)”--base <ref> compares the graph of your working tree with the one at a git ref (a branch, tag or commit). The base is read with git, without a checkout, using the config file as it is at that ref. Components are matched by file and name, so moving a component down its file is not a change, and a renamed file shows as one removal and one addition.
npx --no-install sygnal-check --graph=html --base mainThe page draws added components and edges in green, removed ones as faded red dashed cards where they were, and changed ones with an amber mark (a folded group shows how many of its components changed). The sidebar gets a Changes list, the detail panel says what changed in the selected component, and the Changes only filter hides the rest.
Other formats take --base too:
--graph --base mainprints a short summary (+ New,- Old,~ Header: +action CLOSE, -action TOGGLE).--graph --json --base mainprints the difference as JSON, not the graph: the keys of the added and removed components, each changed component’s changed fields ({ added, removed }lists,{ base, head }for its kind, entry and route), and the added and removed event types. Use it to post a comment on a pull request. The sygnal-check README has the full shape.--graph=mermaid --base mainmarks the added, removed and changed components and edges.
In CI, fetch the base first:
- run: git fetch origin main --depth=1- run: npx --no-install sygnal-check --graph --json --base origin/main > graph-diff.json--base exits with code 2 when the directory isn’t in a git repository, the ref doesn’t exist, or a scanned path is outside the repository.
--head <ref> compares with another commit instead of the working tree.
What a change does (--report)
Section titled “What a change does (--report)”The graph comparison says which components, actions and sinks exist that didn’t before. --report also compares what is inside them, so a reviewer can see what a change does without trusting its description:
npx --no-install sygnal-check --report --base mainIt prints markdown for a pull request comment (--json prints the data, --out writes a file). For each changed component:
- Actions: what triggers each one (a click on
.add, a key, an event from a child), and whether that was added, removed or rewired. - State: the keys each changed action reads and writes, before and after.
- Sinks: new or removed sinks, the requests they send (
POST /api/save → ok SAVED), theEVENTSthey emit. - Guards: the conditions under which a sink does nothing (
ABORT, or a reducer returning the state unchanged), including those in helpers it calls. Before and after are compared case by case, so the report can say that a guard now lets through a case it used to stop, and which case. - Helpers: a changed helper that is made of
if,returnandconstis compared the same way. The report says it was rewritten with the same logic, or shows both versions and a case where they differ. - Blast radius: which other components read the affected state, through lenses, Collections, context and calculated fields, and which listen to the affected events.
Formatting, comments, renamed parameters and locals, and equivalent forms ({ ...state, a } and set({ a })) don’t count as changes. Neither does moving code into a helper when the result is the same. A guard that only gains parentheses, moves its !, or becomes an if / return chain is unchanged. A request built by a helper is compared with its method, address, body and replies written out, so the report says “same request” rather than “new request”. A map moved into a helper is “same values written”. Where the report can’t establish that two versions are the same, it says what changed. It never calls them the same on a guess.
The top of the report is a short list to read first: side effects added to existing actions, removed or weakened guards and trigger filters, and wider writes. That includes a new side effect in a view or in a helper the view calls, which the checker reports as SYG265 or SYG266; the report names the call site. Everything else worth a line is under “Also changed”. Side effects of new actions are in their row of the table, since a new action is what the diff is about anyway.
What it can’t tell you
Section titled “What it can’t tell you”The report says what differs. It doesn’t say whether the difference is right, and an empty list doesn’t mean a change is safe:
- A guard compared case by case treats each comparison as true or false on its own. When both versions use the same comparisons, the report says which way the guard moved. When they use different ones (
n > 3becamen > 5), it says only that the guard changed..lengthis taken to be a whole number of 0 or more. - A helper with loops, assignments or
try, and a condition with more than 12 parts, are reported as changed but not compared. Values aren’t compared for meaning:n + 1and1 + ndiffer. An address built with+is compared as written. - What the view renders isn’t classified (markup, text, styling, conditional rendering). The report only notes that the view’s code changed and which state it reads.
- Package and driver behaviour, and the data that arrives at run time, are outside it.
- A wrong value in new code looks like any other new code.
The end of the report lists what it did not account for: changed files where no difference was found, files that aren’t code, and components it couldn’t read whole.
The report is informational: it exits 0. --fail-on=high makes it exit 1 when the list has a new side effect on an existing action or a removed or weakened guard. Most pull requests that add a request do so on purpose, so start without it.
This workflow compares a pull request with its merge base and keeps one comment up to date, found by the marker on the report’s first line. On a pull request from a fork the token can’t comment, so only the job summary is written.
name: Behaviour reporton: pull_request: types: [opened, synchronize, reopened]permissions: contents: read pull-requests: writejobs: report: runs-on: ubuntu-latest steps: - uses: actions/checkout@v4 with: fetch-depth: 0 # the base commit is read with git - uses: actions/setup-node@v4 with: node-version: 22 - run: npm ci - name: Write the report env: BASE_SHA: ${{ github.event.pull_request.base.sha }} HEAD_SHA: ${{ github.event.pull_request.head.sha }} run: | base=$(git merge-base "$BASE_SHA" "$HEAD_SHA") npx --no-install sygnal-check --report --base "$base" --head "$HEAD_SHA" --out report.md cat report.md >> "$GITHUB_STEP_SUMMARY" - name: Post or update the comment if: github.event.pull_request.head.repo.full_name == github.repository env: GH_TOKEN: ${{ github.token }} PR: ${{ github.event.pull_request.number }} REPO: ${{ github.repository }} run: | id=$(gh api "repos/$REPO/issues/$PR/comments" --paginate \ --jq '[.[] | select(.body | startswith("<!-- sygnal-behaviour-report -->"))][0].id // empty') if [ -n "$id" ]; then gh api -X PATCH "repos/$REPO/issues/comments/$id" -F body=@report.md else gh api -X POST "repos/$REPO/issues/$PR/comments" -F body=@report.md fiUse the merge base, not the base branch’s tip: otherwise commits merged to the base branch since the pull request was opened read as the pull request undoing them. GitHub refuses comments over 65,536 characters; on a very large pull request, cut the file before posting it.
The MCP server (sygnal-check mcp) has the same report as the report tool ({ base, head?, paths? }), so an agent can compare what it wrote with what it says it did.
Mermaid and JSON
Section titled “Mermaid and JSON”--graph=mermaid prints a Mermaid flowchart (flowchart TD) for a README or a pull request description, where GitHub draws it. Render edges are solid (Collections labelled with their state key, Switchables with switch), EVENTS edges dotted; --events=false leaves the EVENTS edges out. The page’s Copy as Mermaid gives the same text.
npx --no-install sygnal-check --graph=mermaidflowchart TD n0["LaneComponent"] n1["RootComponent"] n2["TaskCard"] n0 -->|"[tasks]"| n2 n1 -->|"[lanes]"| n0 n0 -.->|"DELETE_LANE"| n1--graph --json (or --graph=json) prints the graph itself, an InspectGraph, the same shape the runtime inspect() returns. It is what coding agents read (see Building with AI Agents). --graph alone prints a text summary. --out <file> writes any of these formats to a file.
Privacy and security
Section titled “Privacy and security”- Nothing leaves your machine. The page is one file with its scripts and styles inline. Its content security policy forbids loading or connecting to anything, so it works offline and from
file://. It never runs your app’s code. - What a page file contains: the graph (component names, file paths, line numbers, action and state key names, selectors, event types and the findings’ messages, not your source code) and the project’s absolute path, for the editor links. Keep that in mind before you share a file written with
--out. - Live mode (
--watch) listens on127.0.0.1only, on a random port, behind a random token in the URL, and checks theHostheader. It serves the page and its update stream, nothing else. - The Vite route answers only local requests (a loopback client, a local
Hostor one inserver.allowedHosts, a localOrigin), onlyGETandHEAD, and exists only in the dev server: never invite build,vite previewor Vitest. Live data travels between tabs of the same origin through aBroadcastChannel, with no server in between. - VS Code runs the page under a strict policy with a per-page script nonce and no access to remote content or local files; links are opened by the extension, only inside the project.
Known limits
Section titled “Known limits”The graph is built from the source, so anything decided at run time can be missing or approximate:
- A component tag, an event type or an action name that is computed, or comes from a helper in another module, may not be linked. Unresolved tags stay visible as “not in scanned files” cards; an action whose trigger the checker can’t see is shown as an unknown trigger in the detail panel, but isn’t listed as unreachable unless SYG102 reports it. The runtime graph (DevTools, or live data in the Vite page) shows what really happens.
- Astro pages (
.astrofiles) aren’t scanned, so the components they mount aren’t marked as entries. - In VS Code, “the component under the cursor” is approximate: a component counts from its first line to the next component in the file.
- At around 2,000 components, the folded overview still has dozens of group cards; there is no second level of grouping yet.
- In canvas mode (over about 400 drawn cards) the drawing has no keyboard navigation (use the component list), Download SVG is empty, the
--basecolors aren’t painted on the cards (the badges, the Changes list and the filter still work), and components with no instance aren’t faded in live data. - Event bus nodes can sit far from the components they connect.
- With
--base, removed context andPARENTedges aren’t drawn, and--basedoesn’t combine with--watch. - Live data matches a component to its card through the dev server’s mark. A component with no top-level name (an anonymous default export, a function defined inside another) has no mark, and is matched by name only when exactly one card has that name.
Related
Section titled “Related”- Diagnostics: the checks behind the findings, and
inspect() - Building with AI Agents:
--graph --jsonand the MCPgraphtool - Types: the
InspectGraphfields - Editor Setup: the VS Code extension
- Debugging: the DevTools extension